
Shocking Help
Shock data can be used for many different things. Lots of times, it’s thought that the shock data is only good for tuning – finding that sweet spot of dampening. Just as often, the shock data can show other things, especially when something is wrong in the suspension. While the data won’t tell us exactly what is wrong, it can show us symptoms of the root cause and allow us to dig deeper.
The data can also show us thing that we don’t always feel while driving the car. The graphs here show these things. As a little back story, there were no complaints about cornering performance or braking performance. Four different people had driven the car without any comments of weird handling or any problems, but we can see there is a problem.
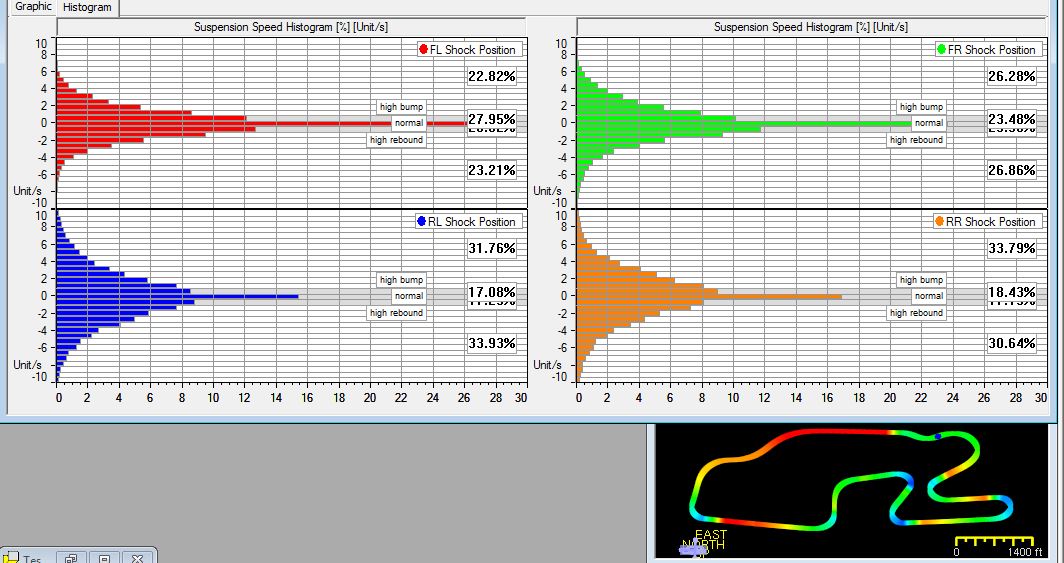
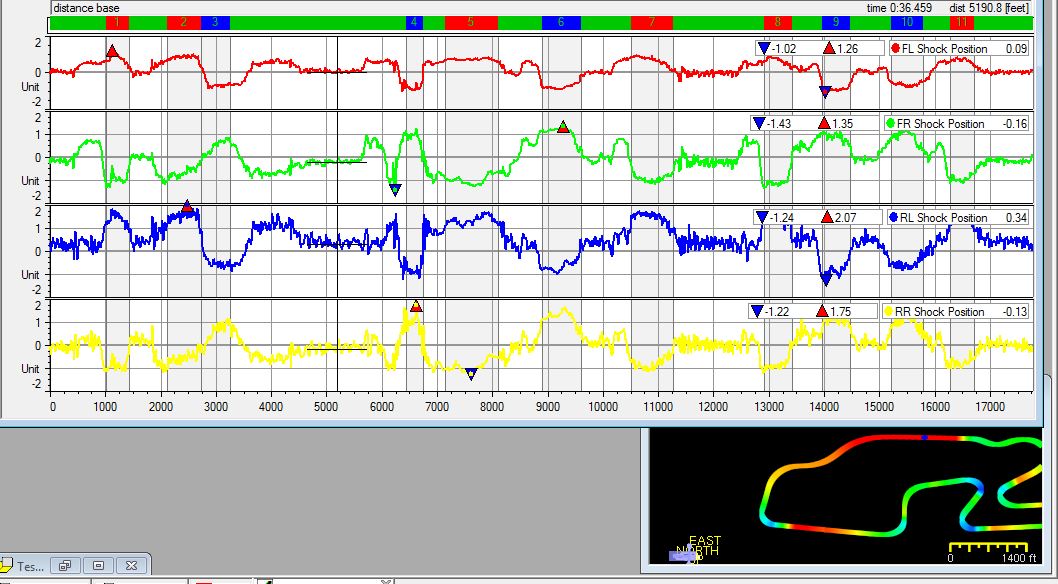
Examining the graphs, we can see the Front Left suspension is not working correctly. First, looking at the histograms, you can see the long bar at zero, showing this shock spends much more time moving at a very slow speed. Next, looking at the shock position graphs, we can see that the Front Left moves slightly less than the other shocks.
Examining the graphs, we can see the Front Left suspension is not working correctly. First, looking at the histograms, you can see the long bar at zero, showing this shock spends much more time moving at a very slow speed. Next, looking at the shock position graphs, we can see that the Front Left moves slightly less than the other shocks.

Finally, the easiest place to see the problem is the shock velocity graph. We can see in the velocity graph that the Front Left is moving much slower than the other shocks, even when set the same. This really tells us that there is an over abundance of friction in that corner that is keeping the suspension from moving freely. A thorough examination of the suspension found that the bushings were worn and binding.
So, while we can use shock position sensors to help us tune our dampers and get us to the perfect set up, they can also help us diagnose problems. Often times, the problems can be fairly minor, but getting everything working right leads to faster laps and more wins.
So, while we can use shock position sensors to help us tune our dampers and get us to the perfect set up, they can also help us diagnose problems. Often times, the problems can be fairly minor, but getting everything working right leads to faster laps and more wins.
Jan 26th 2021
Recent Posts
-
Position Sensors
So you want to know where something is? There are a lot of options! In motorsports we measure the po …Feb 2nd 2025 -
Pressure Sensor Info
So you want to measure a pressure? Gauge or absolute? Air or liquid? If air, gauge, absolute, or dif …Jan 22nd 2025 -

Driver health, monitoring, and performance
I was surfing Instagram and saw Dr. David Ferguson, of the Spartan Motorsports Performance Lab, post …Mar 22nd 2022