

Monitoring Driver Core Temp and Heart Rate
Everyone has felt hot in a race car wearing full Nomex undergarments and a race suit. Even if you are only a DE driver and have tracked on a hot day wearing short sleeves and pants, you have experienced how the physical exertion can have an effect on you. Everyone ends up tired, sweaty, and well, ready to do it all over again the next day!
Using Yellowcog Pilot-CAN devices, a HR monitor, and the CORE temp sensor, we are able to not only measure the drivers core body temp, but we an also add it to the data from the session! Now you can track not only the driver's HR, exertion, and calorie burn, but you can monitor their core body temp. In series and/or cars that have telemetry, you an then broadcast this data to the pit wall, where the team can see how hard the driver is working and use it to determine driver changes and strategy. This great data also allows drivers and teams to design better fitness programs. For drivers who train for being in the car, they can incorporate heat sessions, through sauna, steam rooms, and even outdoor summer workouts where they can match their training environment to the actual conditions they have to train under!
AiM has some great ways to visualize this data. Starting out with a single lap, you an see the HR vary and only a small increase in the core temp. This is not surprising as the bodies thermoregulation doesn't go out of control quickly, but slowly builds. The HR changes during the lap and the you can see that it's overall pretty low (it's probably the driver's amazing physical fitness :) )

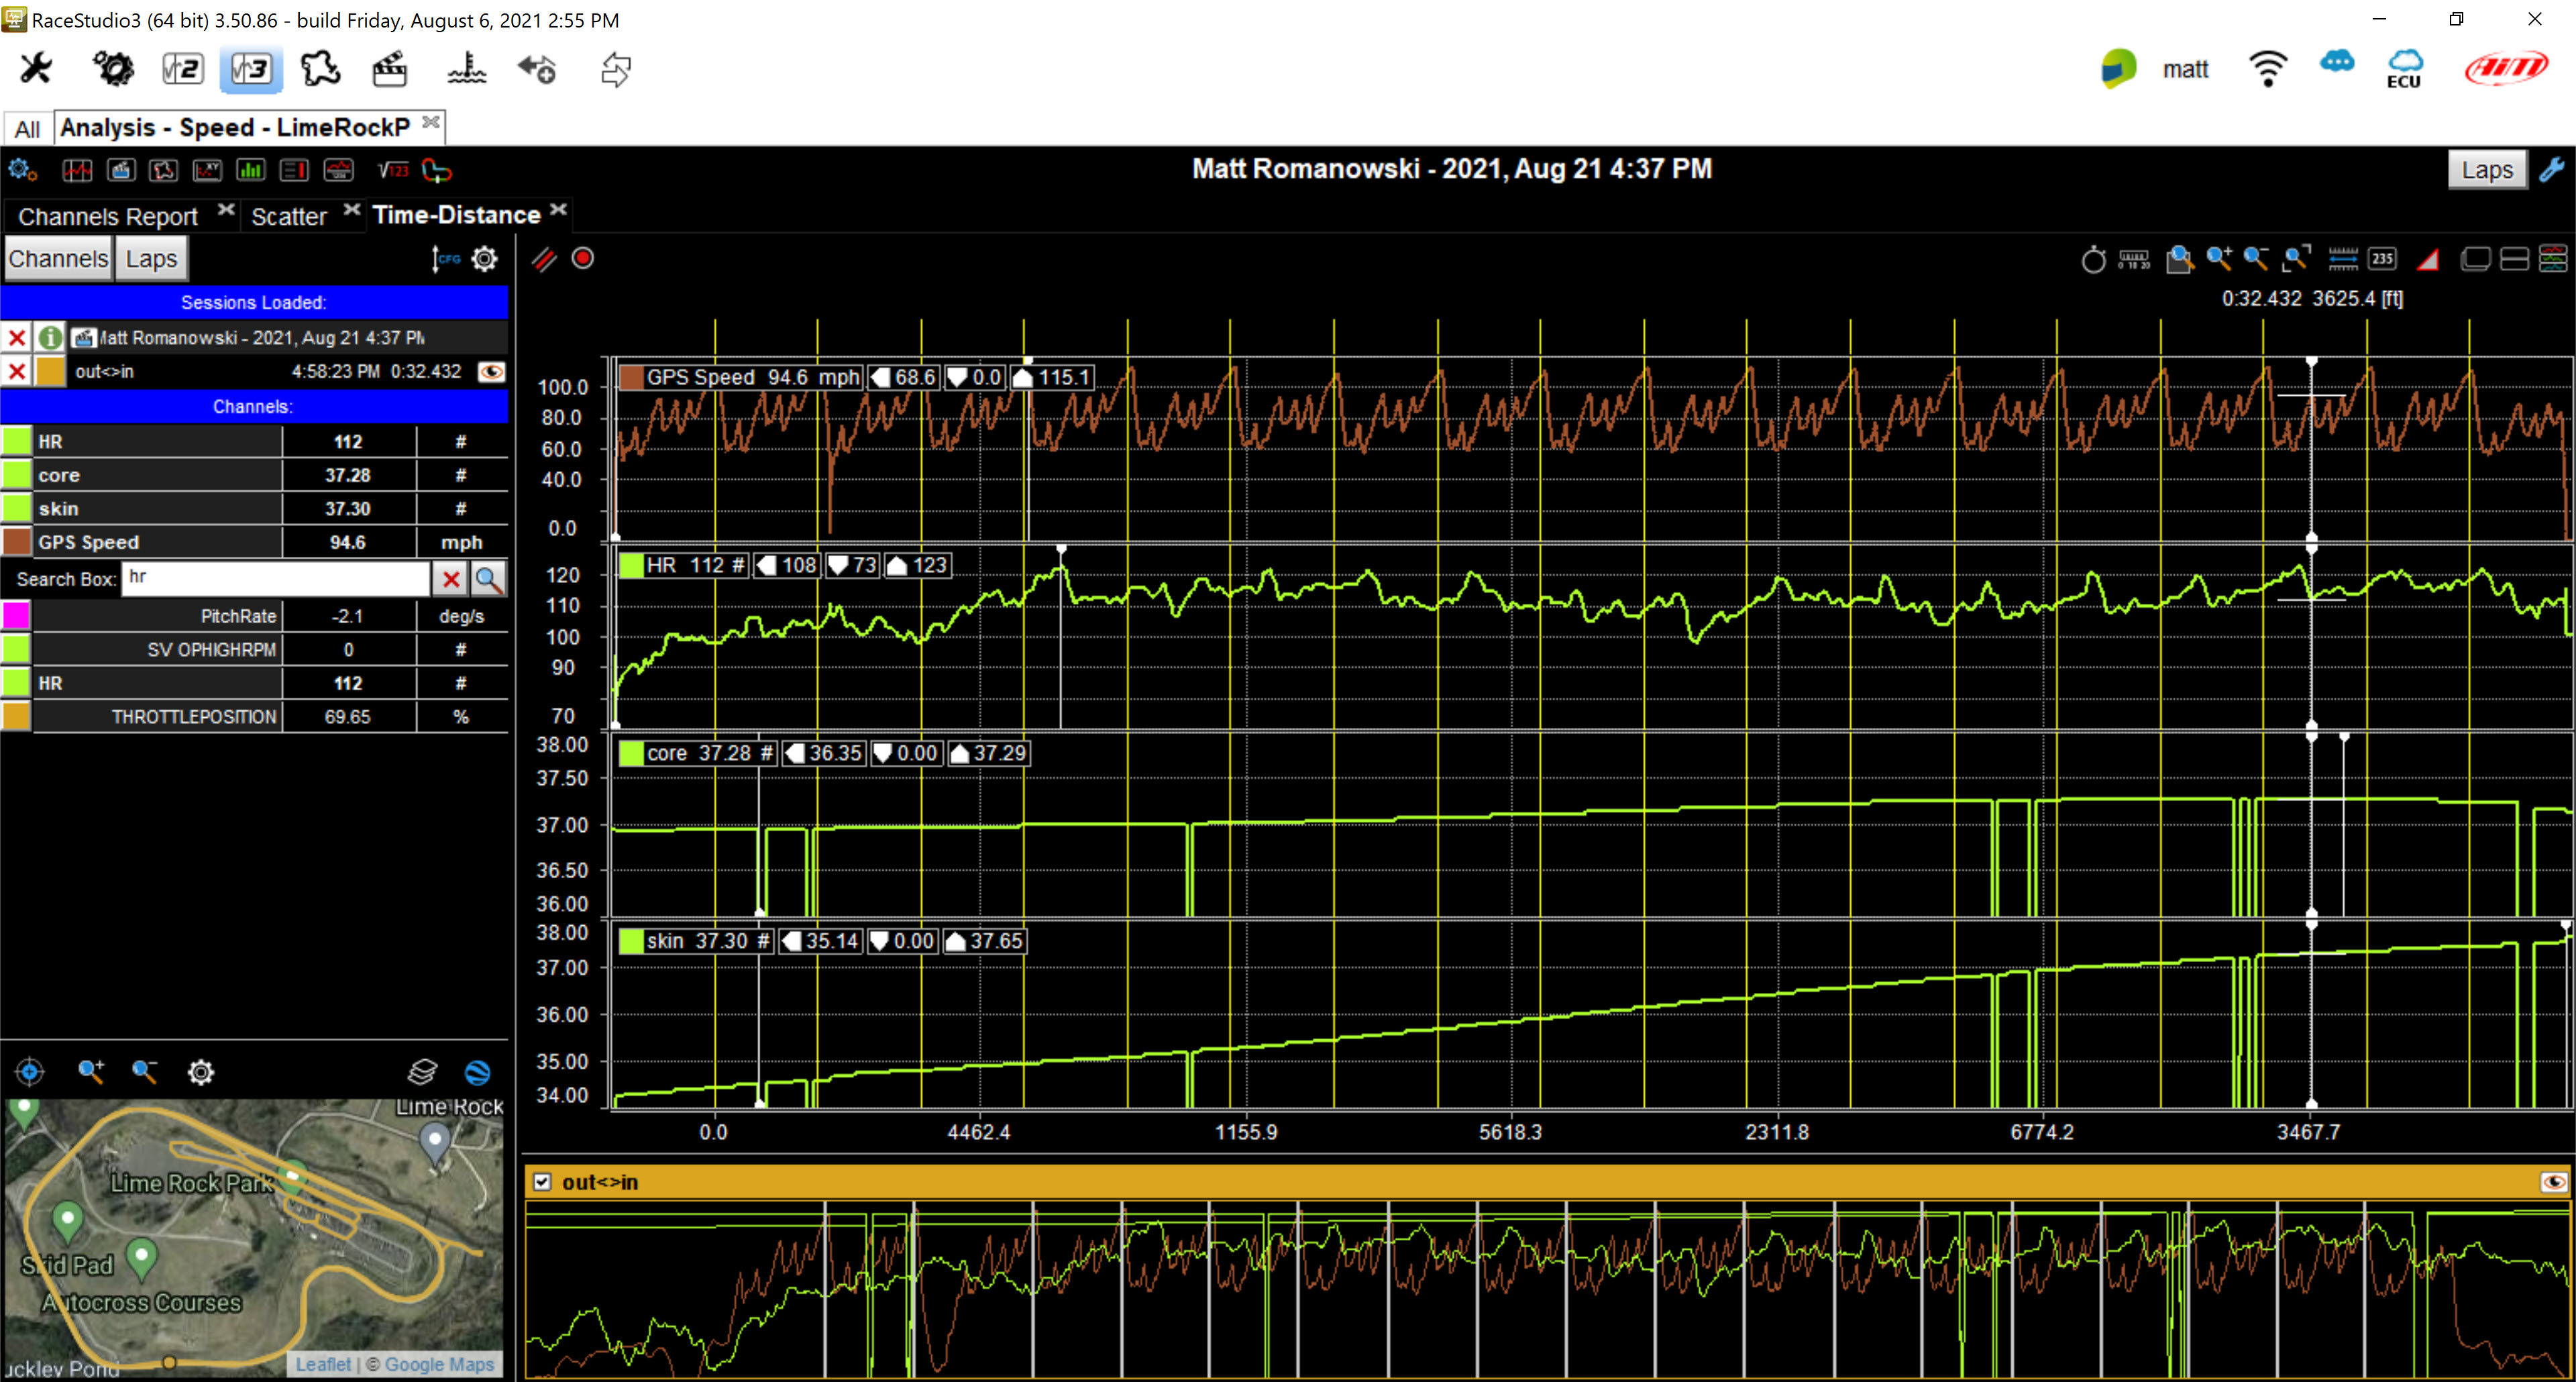
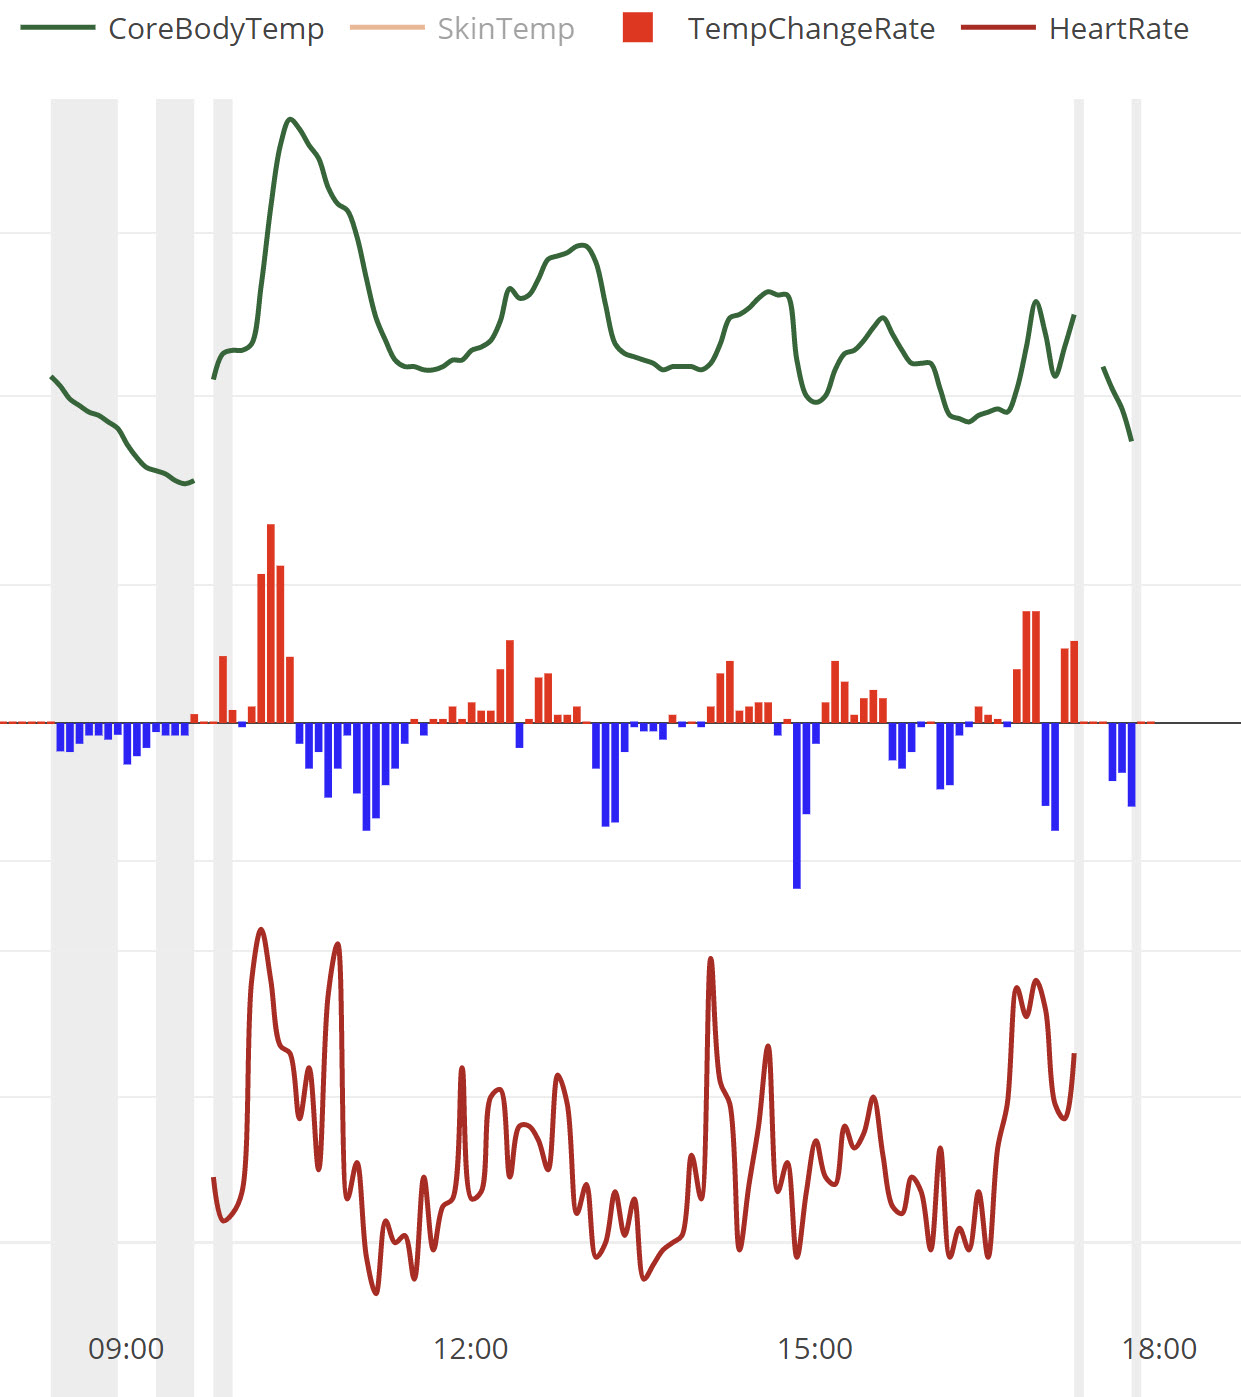
When we zoom out to a full session, 20 minutes in this case, you can see the HR comes up and stabilizes, while the bodies core temp and skin temp continue to rise through the entire session. In this short session, you can see a nearly 1° C / 1.71° F rise in core temp and 2.5° C rise in skin temp. This increase puts the human body temp at an elevated level and certainly reduces performance. You can read some more on overheating and what it does here and here.
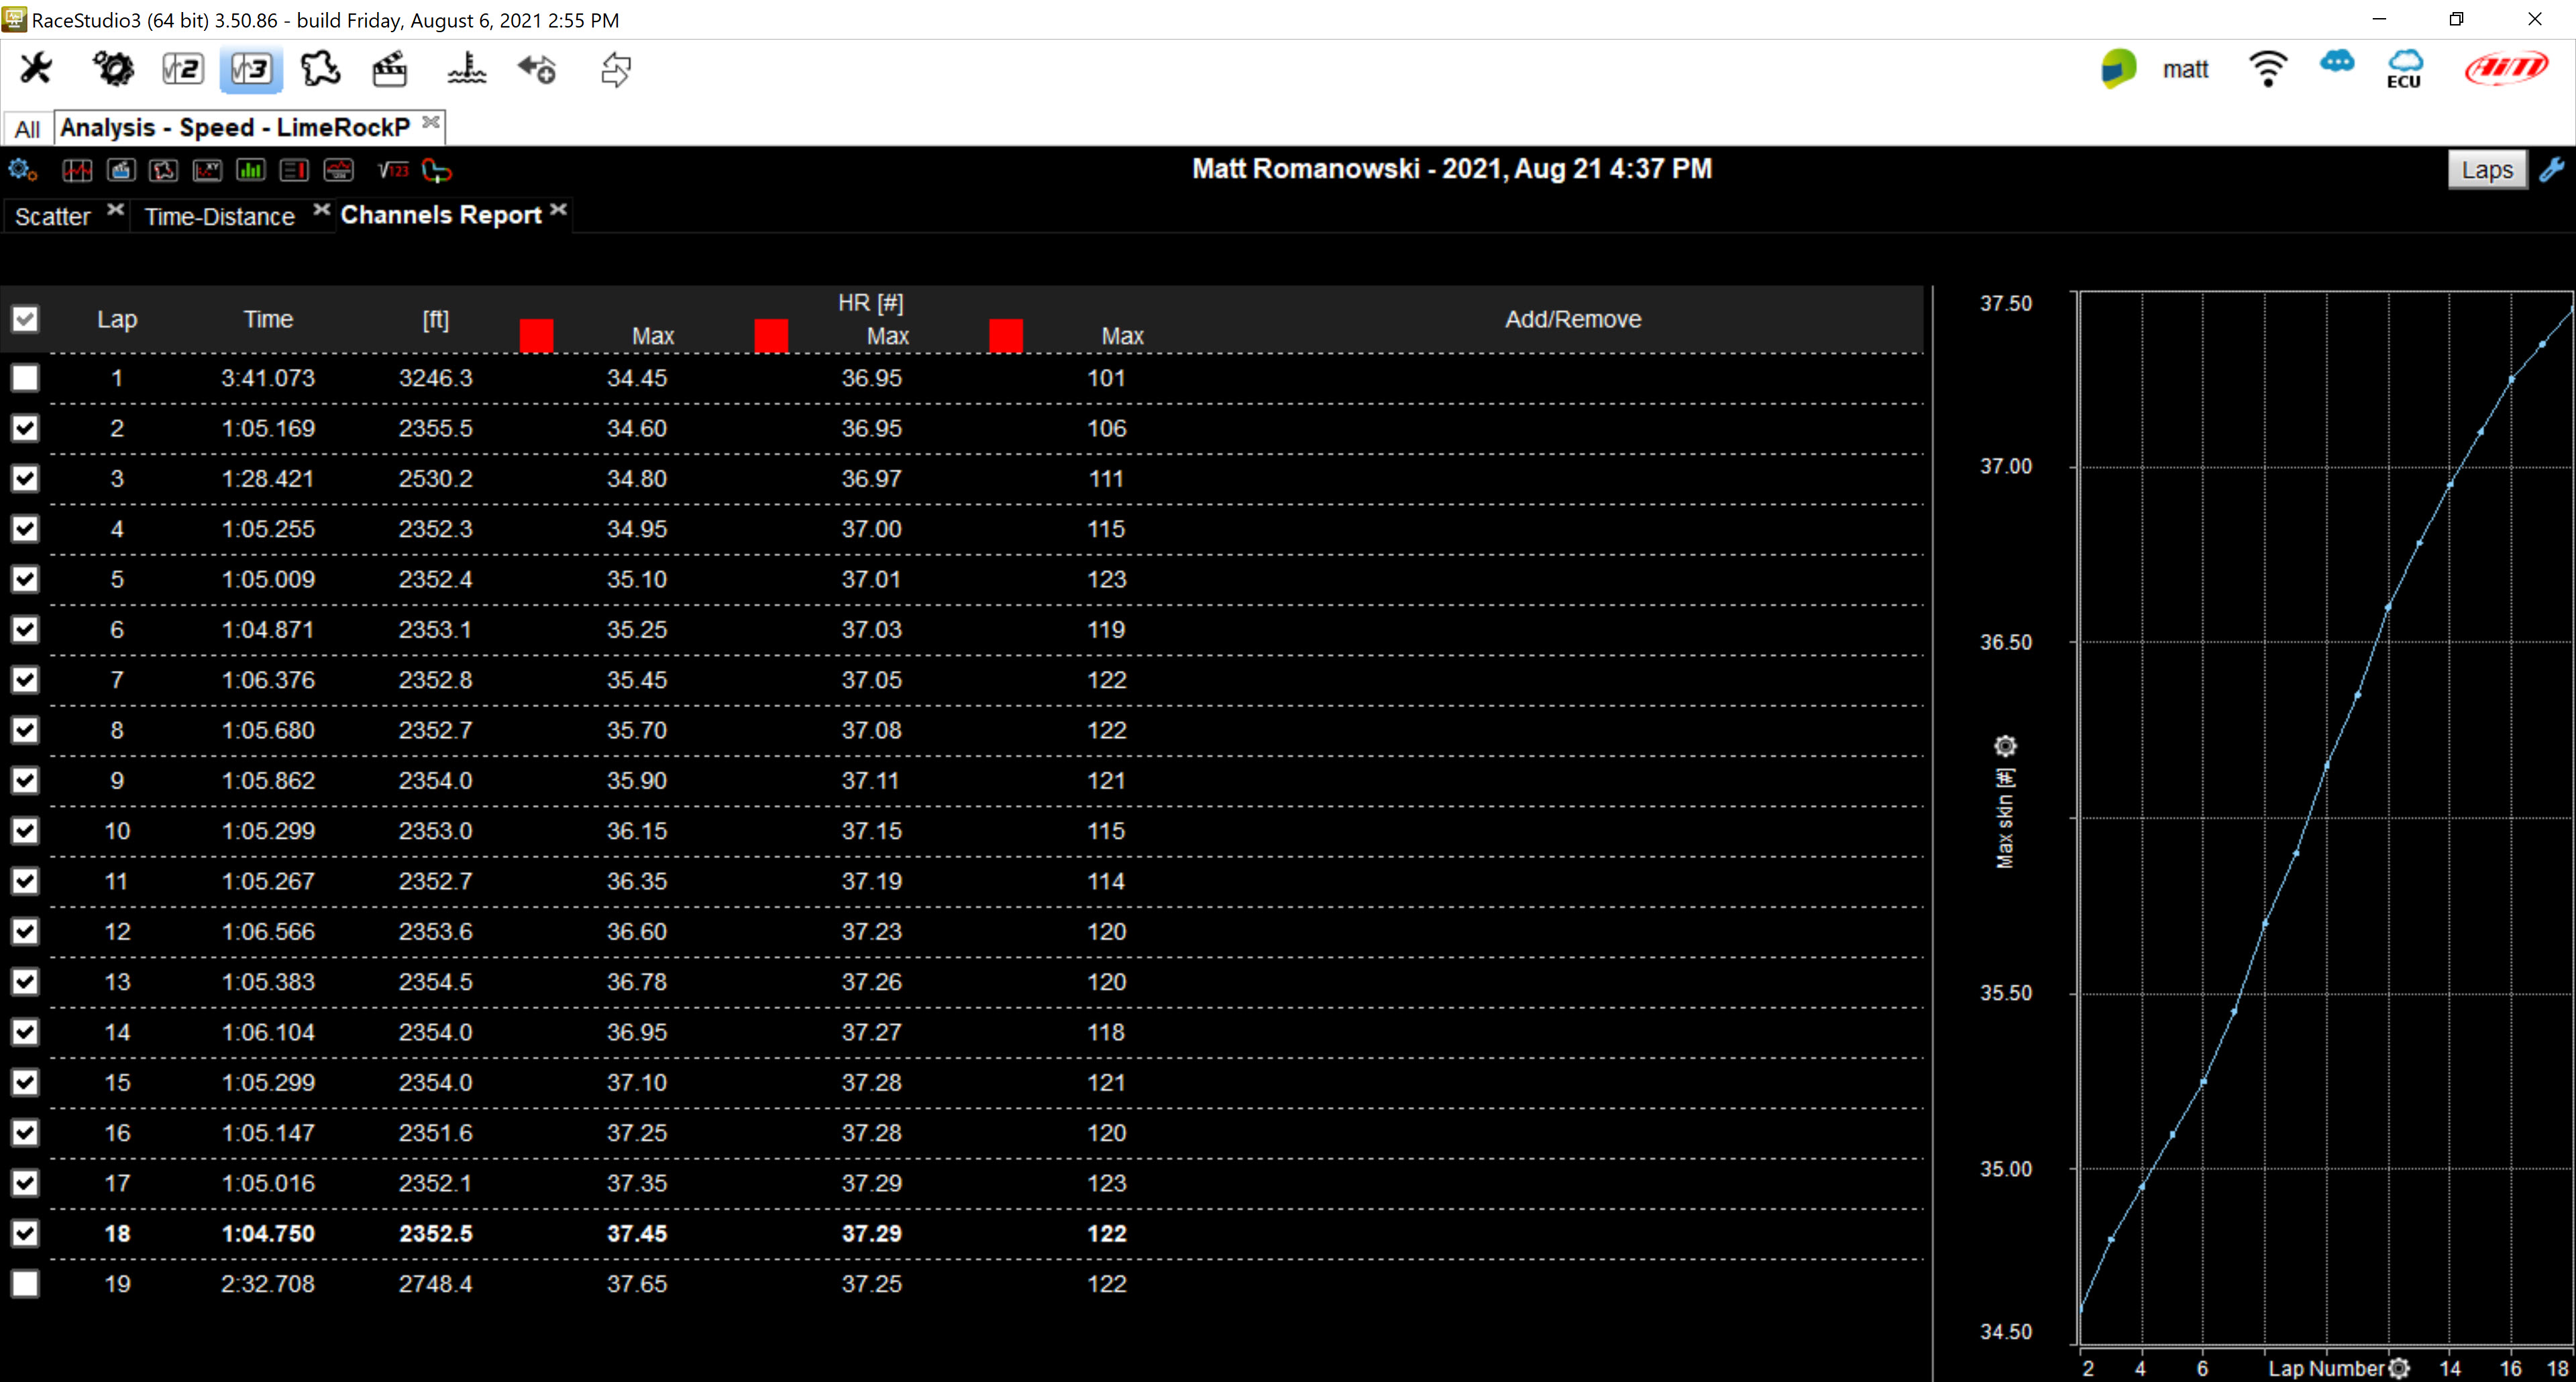
We can also take that same data and put it in a tabular form were we can simply list the max, min, average, etc. of the reading in a chart. That gives us a great numeric visualization of the numbers and how they change. In the example below, we have columns for lap number, lap time, lap distance, max skin temp, max core temp, and max HR. The graph on the right is showing max skin temp on the Y (vertical) axis and lap number on the X axis (horizontal). This is a great way to see that the skin temp was constantly increasing throughout the session with no signs of coming into any sort of stabilization.
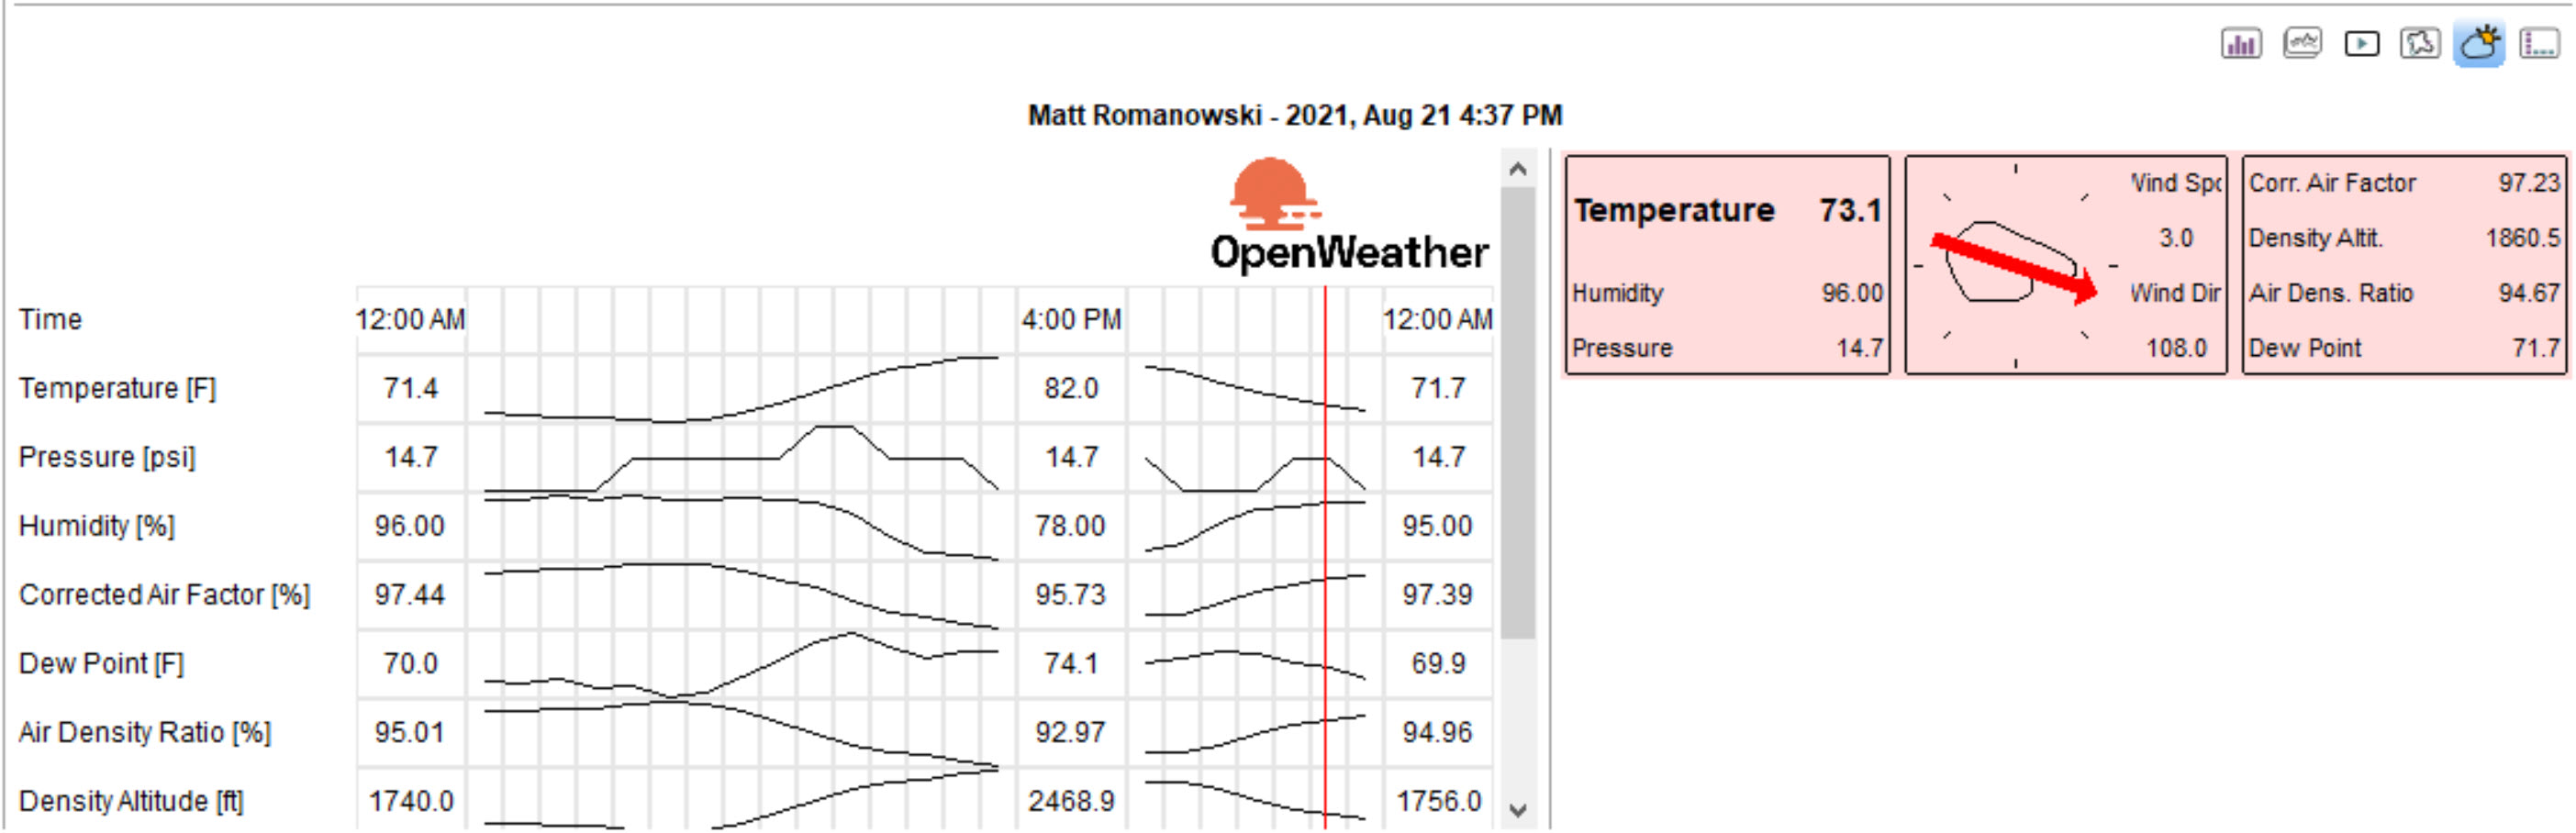
I'm sure by now you are asking, but what were the ambient conditions / weather of the day? A nice feature of RS3 Analysis is the included weather information from the session. Linked directly from the time and location of the data, the weather portion of RS3 Analysis gives you all of the relevant weather data. We can see this driving session was at 16:37 and then see where the weather was at that point. It was 82°F, 78% humidity, and a slight breeze of 3 mph. The "feels like" temp was approx. 91°F, so it was a hot, muggy day!
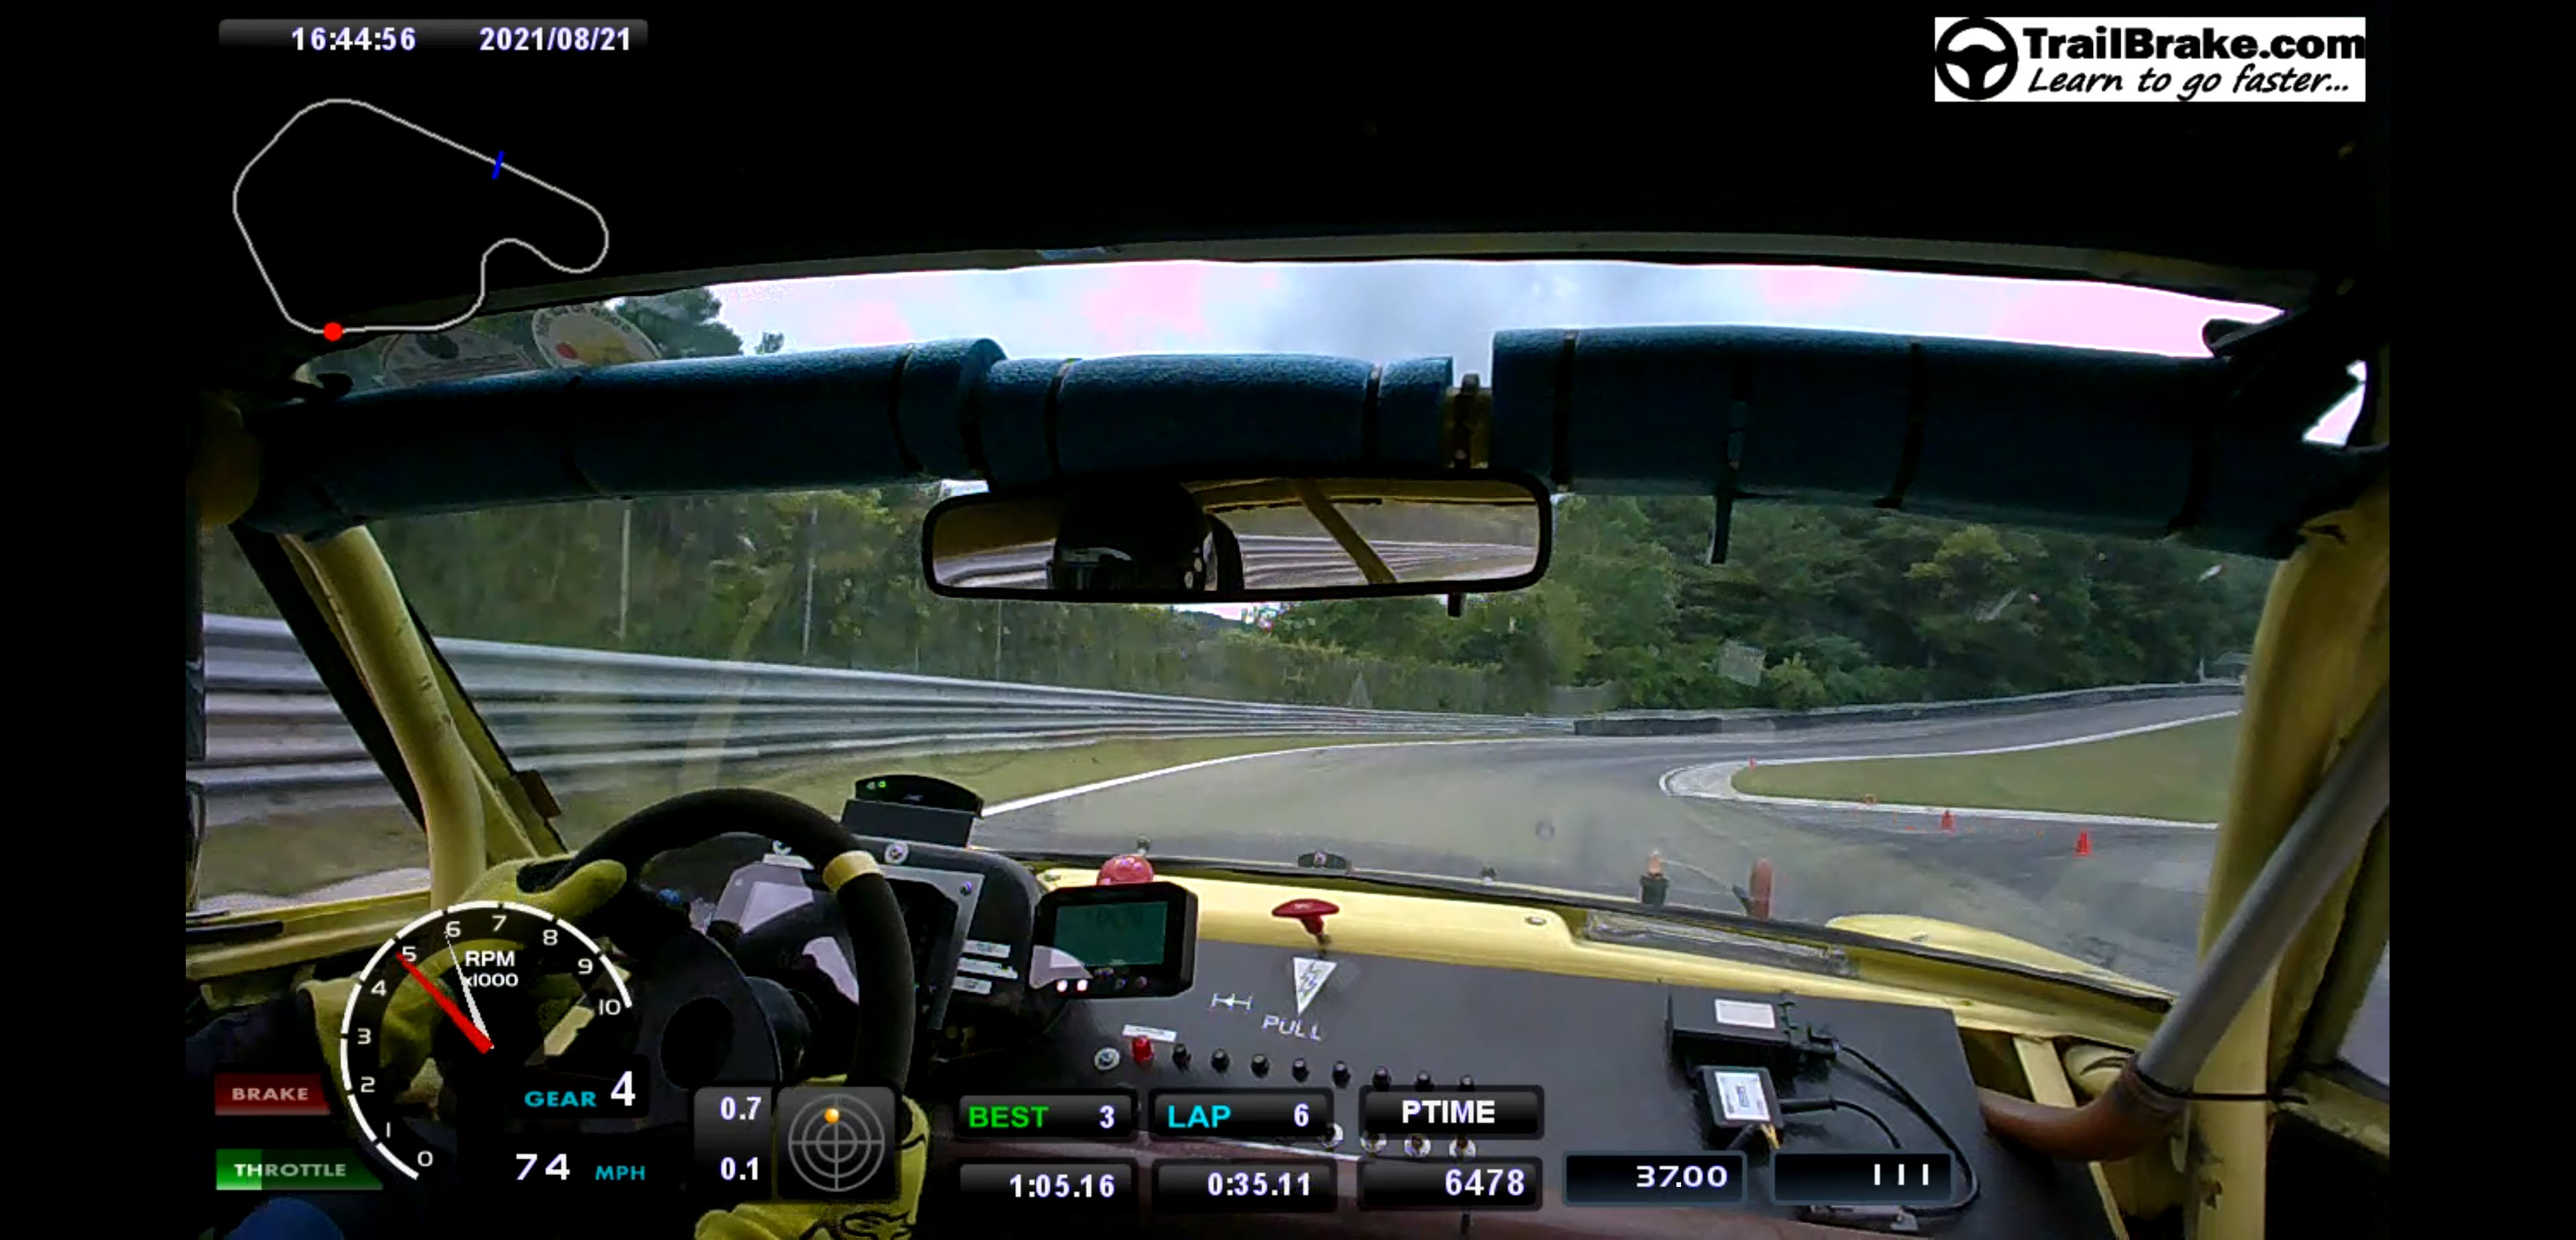
And as with any AiM logger, you can connect it to a Smartycam HD, where these metrics are available to be written real time on the video. You can see the core body temp of 37°C and the HR of 111 bpm on the bottom right of the screen. This simply adds to the power of the numbers, being able to see the biotelemetry on the video, with context of what is going on in front of the driver.
The Core Body Temp sensor also has a great app that will chart your body temp for the entire time the sensor is worn, not just while in the car. This gives great insight into how your core body temp increases, but also how it decreases after the session. When looking at a day's view, you can very easily see the spikes caused by sessions in the car!
For folks who want to learn more and dive deeper, one of the leading researchers and practioner is Dr. David Ferguson. He has edited a fantastic book, The Science of Motorsport. If you are interested in digging in and learning more, this is the best piece of literature available. I did a video on HR and HRV in drivers with Dr. Ferguson back in 2019 that is available here.
In conjunction with AiM Sports, LLC, I co-hosted two of their excellent webinars with Roger Caddell and Dr. Ferguson on biotelemetry and engineering the driver. The video on Measuring Driver Fitness and Engeering the Driver are both great information for drivers and anyone involved in motorsport.
Finally, if you have any questions or are interested in learning more about integrating HR, Core Temp, Skin Temp, Blood Oxygen, or more into your data, please reach out to us. We are always interested in new ideas, thoughts, and helping people increase their performance and reduce their risk.
Recent Posts
-
Position Sensors
So you want to know where something is? There are a lot of options! In motorsports we measure the po …Feb 2nd 2025 -
Pressure Sensor Info
So you want to measure a pressure? Gauge or absolute? Air or liquid? If air, gauge, absolute, or dif …Jan 22nd 2025 -

Driver health, monitoring, and performance
I was surfing Instagram and saw Dr. David Ferguson, of the Spartan Motorsports Performance Lab, post …Mar 22nd 2022